
How to read stock charts like a pro trader is a skill that separates successful investors from those who simply guess and hope. If you’ve ever felt overwhelmed looking at lines, candles, and indicators on a trading platform, you’re not alone—but you’re also not stuck. Whether you’re a complete beginner or someone with a few trades under your belt, learning to interpret stock charts is the key to making informed, confident trading decisions.
In this blog post, you’ll discover exactly how professional traders read charts to spot patterns, time entries and exits, and reduce risk. We’ll break down candlestick patterns, technical indicators, trendlines, and chart tools in a way that’s easy to understand—even if you’ve never traded before. By the end, you’ll have the foundational knowledge needed to read any stock chart and start trading smarter.
So if you’re ready to stop relying on tips and guesswork, and want to start thinking like a pro trader, let’s get started.
Why Every Trader Must Understand Stock Charts
Many retail traders lose money simply because they make decisions without reading stock charts. Stock charts give you historical and real-time price movements, helping you spot trends, reversals, and momentum shifts. Understanding charts allows you to predict potential outcomes instead of reacting blindly to news or tips. Whether you are a day trader or long-term investor, stock chart reading gives you an edge—something every successful trader relies on.

Use data like: 65% of successful traders actively use chart analysis tools, according to a recent FINRA report.
Key Components of a Stock Chart You Must Know
Before diving into patterns and indicators, get familiar with the chart’s structure. Every chart contains the following essentials:
- Timeframe: Determines how much data is shown (e.g., 1-minute, 1-day, 1-week candles). Shorter timeframes suit day traders, longer ones for swing/position trading.
- Price Scale: Linear vs. logarithmic. Logarithmic scales show percentage moves more accurately for long-term charts.
- Candlesticks: These represent open, high, low, and close prices within a given period.
- Volume: Reflects the number of shares traded; higher volume confirms stronger price movements.
- Indicator Panel: Below the price chart, indicators like MACD, RSI, or volume oscillators give technical insights.
How to Read Candlestick Patterns Like a Pro Trader
Candlestick charts are preferred by most professional traders. Each candlestick shows price behavior for a set period, offering visual cues of market sentiment.
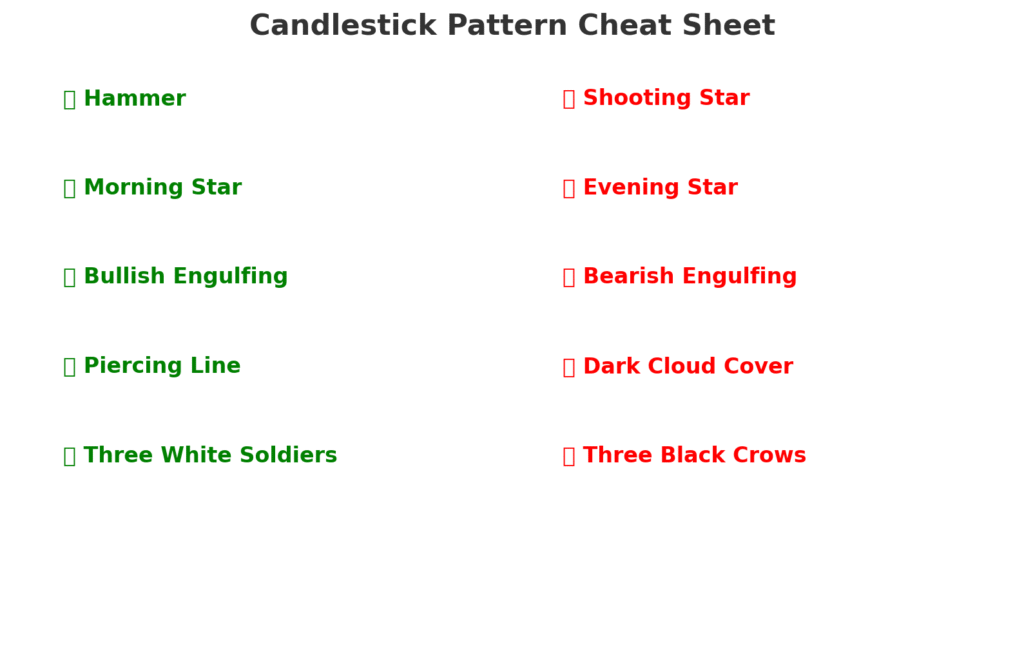
- Bullish Patterns: Hammer, morning star, engulfing. These suggest a potential upward reversal.
- Bearish Patterns: Shooting star, evening star, bearish engulfing. These indicate a downtrend may begin.
- Neutral Patterns: Doji, spinning top—signals indecision in the market.
Reading candlesticks helps traders anticipate possible price movements before they happen.
Reading Trends and Identifying Support/Resistance
Trend analysis is the foundation of chart reading. Understanding price direction helps you align trades with market momentum.
- Uptrend: Series of higher highs and higher lows.
- Downtrend: Series of lower highs and lower lows.
- Sideways: Price moves within a range, with no clear direction.
Support is a price level where buying typically emerges. Resistance is where sellers appear, capping price moves. Identifying these areas lets traders plan entries and exits more effectively.
Top Technical Indicators Pro Traders Rely On
Technical indicators give deeper context to price movement. Here are the top ones pro traders use:
| Indicator | What It Shows | Best Use Case |
|---|---|---|
| SMA/EMA | Trend direction | Entry/Exit timing |
| RSI | Overbought/Oversold conditions | Spotting reversals |
| MACD | Momentum shift | Trend confirmation |
| Bollinger Bands | Volatility & breakout points | Price extremes |
| Volume Oscillator | Buy/Sell pressure | Confirm breakouts |
How to Combine Indicators Without Getting Confused
Using too many indicators can overwhelm traders and cause “analysis paralysis.” Instead, use simple combinations:
- MACD + RSI: Confirms momentum and overbought/oversold conditions.
- Moving Average + Volume: Helps confirm trend strength and entry timing.
- Bollinger Bands + RSI: Detects volatility and likely reversal points.
Always test combinations on demo accounts before using real capital.
Mistakes to Avoid When Reading Stock Charts
Even with the right tools, beginners often fall into traps:
- Ignoring volume during breakouts.
- Using too many indicators without understanding them.
- Forcing trades that don’t align with the trend.
- Neglecting higher timeframes, which provide more context.
- Letting emotions override signals.
Pro Tips to Read Stock Charts Like a Pro Trader
Here’s how professional traders get consistent:
- Use a chart journal to track setups and results.
- Review pre-market and post-market activity.
- Focus on volume spikes and institutional moves.
- Combine fundamentals with technicals for a complete edge.
- Stick to repeatable patterns you’ve tested.
These habits turn amateur traders into consistent performers.
Best Platforms to Practice Stock Chart Reading
Free and reliable charting tools help beginners become pros:
- TradingView: Intuitive UI, multiple indicators, and backtesting tools.
- ThinkorSwim by TD Ameritrade: Advanced platform for in-depth charting.
- Webull: Great for mobile-friendly chart tracking.
- Investing.com: Simple charts for quick access.
Final Thoughts: Build Your Edge with Chart Reading
Learning how to read stock charts like a pro trader is not a one-time effort. It’s a process of observation, practice, and adjustment. By understanding candlesticks, indicators, trends, and combining them smartly, you gain a trading edge that sets you apart. Start simple, test strategies, and journal every trade. Over time, reading charts becomes second nature.
Conclusion
In conclusion, mastering how to read stock charts like a pro trader is a skill that can transform the way you approach the stock market. From understanding candlestick patterns and recognizing trends to using key technical indicators and avoiding costly mistakes, each technique you’ve learned in this guide is a step toward smarter, more confident trading. The real edge lies not in memorizing every pattern, but in practicing consistently, keeping a chart journal, and applying these tools with discipline and clarity.
Now it’s your turn—what chart-reading techniques have helped you make better trading decisions? Drop your thoughts or questions in the comments below! We’d love to hear how this guide has helped your trading journey.